Recently I got a fun challenge handed to me where the scenario was to use 20 MikroTik access points to continuously measure wireless throughput for clients in a large arena. The collected metrics could then be used as a baseline component and indicator of a good or bad wireless user experience.
The MikroTik model chosen was the “hAP ac lite” or RB952Ui-5ac2nD which supports 2.4Ghz and 5GHz (802.11 a/b/g/n/ac). Their OS, RouterOS, supports lots of security, wireless and routing features to play with. All this for a price tag of around 50 USD. Sweet!
To solve this challenge we need some way to execute actions on the MikroTik, then extract that output data into some useful format which we then can analyze and store. Then scale this up to n devices and repeat indefinitely.
Since I’m not a hard-core programmer able to hack out a solution in golang during breakfast, I’ll go with using the tools I’m familiar with, namely Ansible and Elastic Stack. Ansible is a tool to perform system/server/network automation using a set of tasks then executing these on a group of hosts. Elastic Stack is a collection of tools allowing you to retrieve, store and visualize data.
Here is a visual representation of how these components would work together:

Splunk was already being used for data storage, so why not have Ansible spread the love and send JSON to both services simultaneously. The more the merrier!
First we need to have all of the nodes at a certain configuration level.
Setup.yml:
 - hosts: mt-setup
   gather_facts: no
   connection: paramiko

   tasks:
     - name: Create the bwtest user allowing access from Ansible
       raw: "/user add name=bwtest group=full password=\"bwpass\" address=11.22.33.44/32"

     - name: Temporary static route for bandwidth-server if needed
       raw: ":if (([:len [/ip route find where comment=bwtest]]) < 1) do={/ip route add dst-address=55.66.77.88/32 gateway=1.1.1.1 comment=bwtest}"

     - name: Wireless 2.4Ghz setup
       raw: "/interface wireless set [ find default-name=wlan1 ] disabled=no distance=indoors frequency=auto ssid=\"2GHz SSID\" wireless-protocol=802.11 bridge-mode=disabled mode=station"

     - name: Wireless 5GHz setup
       raw: "/interface wireless set [ find default-name=wlan2 ] band=5ghz-a/n disabled=no distance=indoors frequency=auto ssid=\"5GHz SSID\" wireless-protocol=802.11 bridge-mode=disabled mode=station"

     - name: Disable 2.4 GHz wlan bridge interface
       raw: "/interface bridge port disable [/interface bridge port find where interface=wlan1]"

     - name: Disable 5GHz wlan bridge interface
       raw: "/interface bridge port disable [/interface bridge port find where interface=wlan2]"

     - name: DHCP client settings 2.4GHz
       raw: ":if (([:len [/ip dhcp-client find where interface=wlan1]]) < 1) do={/ip dhcp-client add add-default-route=no dhcp-options=hostname,clientid disabled=no interface=wlan1}"

     - name: DHCP client settings 5GHz
       raw: ":if (([:len [/ip dhcp-client find where interface=wlan2]]) < 1) do={/ip dhcp-client add add-default-route=no dhcp-options=hostname,clientid disabled=no interface=wlan2}"
We now have all the MikroTiks configured with two active wireless interfaces, DHCP client running on both interfaces and a user for Ansible to continue its work.
Then it’s time to perform the actual performance testing and data collection.
Benchmark.yml:
 - hosts: mt-prod
   gather_facts: no
   connection: paramiko

   vars:
     tikhost: "{{ ansible_host }}"
     tikuser: "bwtest"
     tikpw: "bwpass"
     tikbwhost: "55.66.77.88"
     tikduration: "10"
     tiktx: "100M"
     tikrx: "100M"
     tikdirection: "both"
     colon: ":"

   tasks:
     - name: Disable 5GHz wlan interface
       raw: "/interface wireless set [ find default-name=wlan2 ] disabled=yes"

     - name: Waiting for wireless connection to complete
       pause: seconds=5

     - name: Set static route for 2.4GHz testing
       raw: "ip route set [/ip route find where comment=bwtest] gateway=[/ip dhcp-client get [find interface=wlan1] gateway]"

     - name: Include TCP test instructions
       include: include/bwtest.yml tikproto="tcp" tikfreq="2.4GHz"

     - name: Include UDP test instructions
       include: include/bwtest.yml tikproto="udp" tikfreq="2.4GHz"

     - name: Disable 2.4GHz wlan interface
       raw: "/interface wireless set [ find default-name=wlan1 ] disabled=yes"

     - name: Enable 5GHz wlan interface
       raw: "/interface wireless set [ find default-name=wlan2 ] disabled=no"

     - name: Waiting for wireless connection to complete
       pause: seconds=5

     - name: Set static route for 5GHz testing
       raw: "ip route set [/ip route find where comment=bwtest] gateway=[/ip dhcp-client get [find interface=wlan2] gateway]"

     - name: Include TCP test instructions
       include: include/bwtest.yml tikproto="tcp" tikfreq="5GHz"

     - name: Include UDP test instructions
       include: include/bwtest.yml tikproto="udp" tikfreq="5GHz"

     - name: Enable 2.4GHz wlan interface
       raw: "/interface wireless set [ find default-name=wlan1 ] disabled=no"
We run the bandwidth tests over TCP and UDP using 2.4GHz and 5Ghz. We move the static route around to select our benchmarking interface.
As shown in Benchmark.yml we also include a file called bwtest.yml that executes the actual testing command and formats the output. Including allow us to reuse code instead duplicating it in our playbook.
Bwtest.yml:
- name: Random sleep so we don't DDoS the server
  local_action: shell sleep {{ item }}
  with_random_choice:
    - "0s"
    - "5s"
    - "10s"

- name: Connect to MT and run {{ tikproto }} bandwidth test over {{ tikfreq }}
  local_action: shell ./tikjson.rb {{ tikhost }} {{ tikuser }} {{ tikpw }} /tool/bandwidth-test =address={{ tikbwhost }} =duration={{ tikduration }} =direction={{ tikdirection }} =protocol={{ tikproto }} =local-tx-speed={{ tiktx }} =remote-tx-speed={{ tikrx }} | jq -c '.[][] | .' | sed 'x;$!d'
  register: cmd

- name: Copy JSON output to file
  local_action: copy content="{{ cmd.stdout }}" dest="output/bwtest_{{ tikproto }}_{{ tikhost }}.json"

- name: Rewrite tags in JSON
  local_action: replace backup=no dest=output/bwtest_{{ tikproto }}_{{ tikhost }}.json regexp='.section' replace='section'
- name: Rewrite tags in JSON
  local_action: replace backup=no dest=output/bwtest_{{ tikproto }}_{{ tikhost }}.json regexp='.tag' replace='tag'
- name: Rewrite tags in JSON
  local_action: replace backup=no dest=output/bwtest_{{ tikproto }}_{{ tikhost }}.json regexp='!re' replace='proto'
- name: Rewrite tags in JSON
  local_action: replace backup=no dest=output/bwtest_{{ tikproto }}_{{ tikhost }}.json regexp='null' replace='"{{ tikproto }}"'
- name: Rewrite tags in JSON
  local_action: replace backup=no dest=output/bwtest_{{ tikproto }}_{{ tikhost }}.json regexp='}' replace=', "host"{{ colon }} "{{ tikhost }}", "freq"{{ colon }} "{{ tikfreq }}" }'

- name: Send JSON to log analyzer (Logstash)
  local_action: shell /bin/nc -q1 -w2 logstash.com 23777 < output/bwtest_{{ tikproto }}_{{ tikhost }}.json
  ignore_errors: yes

- name: Send JSON to log analyzer (Splunk)
  local_action: shell /bin/nc -q1 -w2 splunk.com 23777 < output/bwtest_{{ tikproto }}_{{ tikhost }}.json
  ignore_errors: yes
Here we invoke a MikroTik RouterOS API client written in Ruby (http://github.com/astounding/mtik).
These three YAML files put together produce the following JSON output:
{
 "status": "done testing",
 "tx-10-second-average": "1680920",
 "direction": "both",
 "tx-total-average": "1680920",
 "rx-10-second-average": "501408",
 "rx-total-average": "501408",
 "proto": "tcp",
 "duration": "11s",
 "tx-current": "684832",
 "random-data": "false",
 "section": "11",
 "tag": "3",
 "rx-current": "341304",
 "host": "14.52.63.41",
 "freq": "5GHz"
}
Now what?
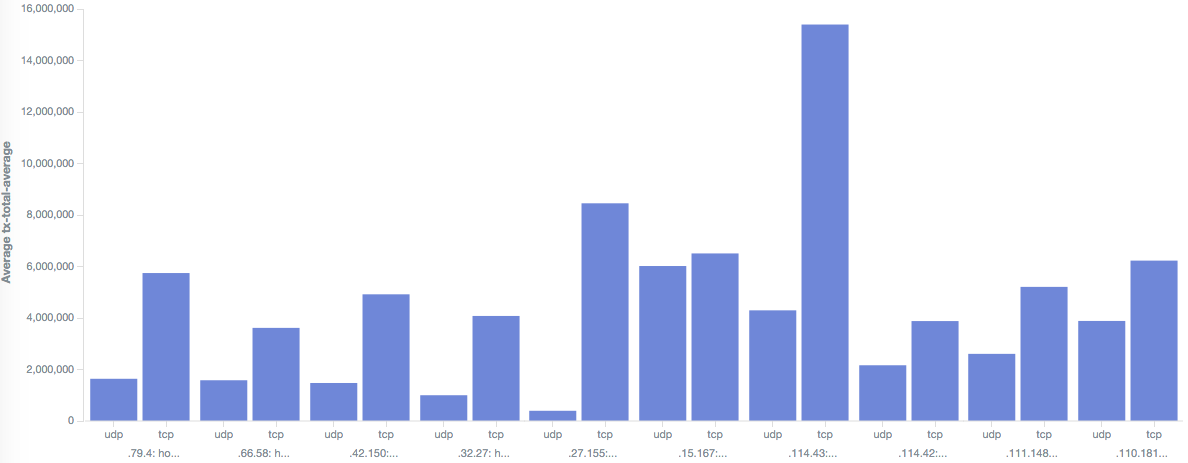
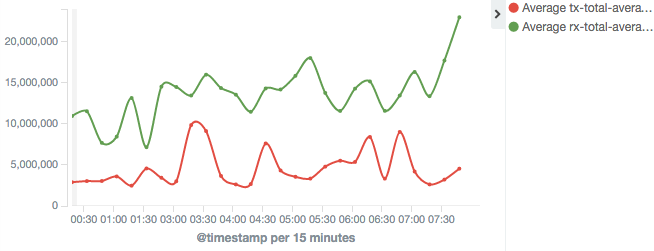
With this data sent to Logstash and Splunk we can finally produce some pretty graphs and gain some insights:
Top performing wireless zone per protocol:

Performance distribution per zone over time:

Total Rx/Tx performance over time:

We’ve only scratched the surface here, but you get the idea. Ansible allows you to automate just about anything and Kibana makes it look great 💪
Check out my Consulting Services if you’re interested in implementing something similar for your organization.


Leave a Reply